DURATION
6 months
MEMBERS
Self: Primary designer
Michelle Ismail: Design collaborator
Smitha Papolu: Design manager
James Theisen: Content designer
TASKS
Customer research, product audit, prototyping & wireframe, UI design, micro-interaction, development hand-off, usability testing
Reimagining income tax estimation in QuickBooks to boost confidence in tax literacy

PROJECT BACKGROUND
Self-employment is a mindset who see themselves as the business. Self-employed individuals spend their time thinking about how to achieve financial stability and taxes and IRS are anxiety-inducing for them because of heavy regulation and rigid systems.
1/3 of QuickBooks companies have a self-employed mindset, with sole proprietors being the largest customer base in QuickBooks platform across developed markets. With the recent boom in self-employed businesses started fueled by the pandemic, there are more new self-employed users than ever who are filing taxes for the first time. This project help make income taxes more approachable and digestible to new and pre-existing businesses.
HYPOTHESIS
By directly addressing this most-represented yet underserved group with gaps between their bookkeeping and income tax, it will improve retention in product and strengthen confidence of the business owner.
PROBLEM STATEMENT
I am a self-employed tax filer
trying to get an understanding of my comprehensive tax liability
but I have no clue how to calculate how much I owe
because I’m unsure how my business income and expenses translate into my taxes due
Which makes me apprehensive of tax time

Research
LEARNING GOAL
We set out to understand how QBO and QBSE users think about taxes they owe.
Do SE tax filers understand how their tax bill is calculated, and what inputs go into this calculation?
2 PHASES
Data transparency
Playground Concept

CONCEPT 1
PLAYGROUND
HYPOTHESIS
Self-employed (SE) tax filers are interested in seeing how different income and deduction amounts affect their tax bill. Seeing an interactive change between different inputs makes taxes more approachable and illustrates the relationship between all tax related elements.
THEMES
Flexibility
Interactivity
Approachable
LEAP OF FAITH 1
If we allow users to playfully project and adjust their income and expenses, then SEs will become more knowledgeable on how those inputs impact their tax bill

TESTED DESIGN
Slider control
We tested this idea of letting users play around with adjusting their income and deduction projection amounts. Our hypothesis is through this playful interaction, users can see how the values affect each other, and boosts their confidence in taking steps to reduce their tax bill.
“I don’t want to play around with fake numbers...For projecting deductions, that’s something I expect the software to tell me.”
“As far as to be able to project, I just need the data and I’m hoping that this system would help walk a dummy like me through this projection”
TAKEAWAYS
SEs do not want to deal with theoretical numbers when calculating their taxes.
Most SEs did not feel comfortable or confident enough to make their own projections, and preferred QB to make projections for them.
LEAP OF FAITH 2
If we allow SEs to add known upcoming transactions they foresee coming in, then they can make more accurate predictions for income and expenses
TESTED DESIGN
Projecting planned transactions
We tested this idea of letting users add planned transactions they foresee are coming up. Maybe they predict a big holiday sale, or an upcoming tax-deductible purchase. With this upcoming transaction added, we can provide better estimation on their tax bill.

“I don’t like thinking about something that is like actually not in my bank account ... three months ahead ... because until it is in my bank account it doesn’t feel real to me”
“I like the real time data ... you can log on anytime of day and see where you are at there it’s real time data is real time updated, I can see what I’ve sold.”
TAKEAWAYS
SEs find it difficult to differentiate between projected transactions and planned transactions
When SEs were given the opportunity to project upcoming transactions, they expected these transaction entries to hit their books.
LEAP OF FAITH 3
SEs are interested in being hands-on with their numbers and want to see a live impact on their tax calculations

TESTED DESIGN
Interacting with data
We tested this idea of letting users interact with their data, showing how all the pieces affect each other. We hypothesized that seeing this relationship and interaction is valuable to the user’s understanding of taxes.
“Why have I been wasting so much time doing it. You know, adding them into the software every day.”
“One of the main reasons why I use this software on an almost daily basis is to calculate to project my deductions and not have to do it myself”
TAKEAWAYS
SEs expect QB to deliver on calculations based on the categorization work they’ve done
Most simply want QB to do the work for them and show them how it gets calculated.
Iterations made based on insights
Because customers want QB to make projections for them, we iterated on the current product to bring more transparency into the QB projections happening on the back-end.
We realized the more playful tools we gave customers, like the income and deductions slider, the more confused they became on how their estimated tax bill was calculated. We decided to move away from this feature completely.

Pivot
Pivoting our solution to help our customers better understand their estimated tax bill. Our new goal became to increase transparency of the back-end calculation to strengthen SE’s perception of accuracy and usefulness.
THEMES
Data-driven
Clarity
User-friendly
THE REAL PROBLEM UNCOVERED
Customers view QB as a place to run their business but view their taxes as highly personal.
Personal information such as tax filing status and income outside of their business significantly impacts their tax calculation, but they were not seeing how QB was factoring in these inputs.

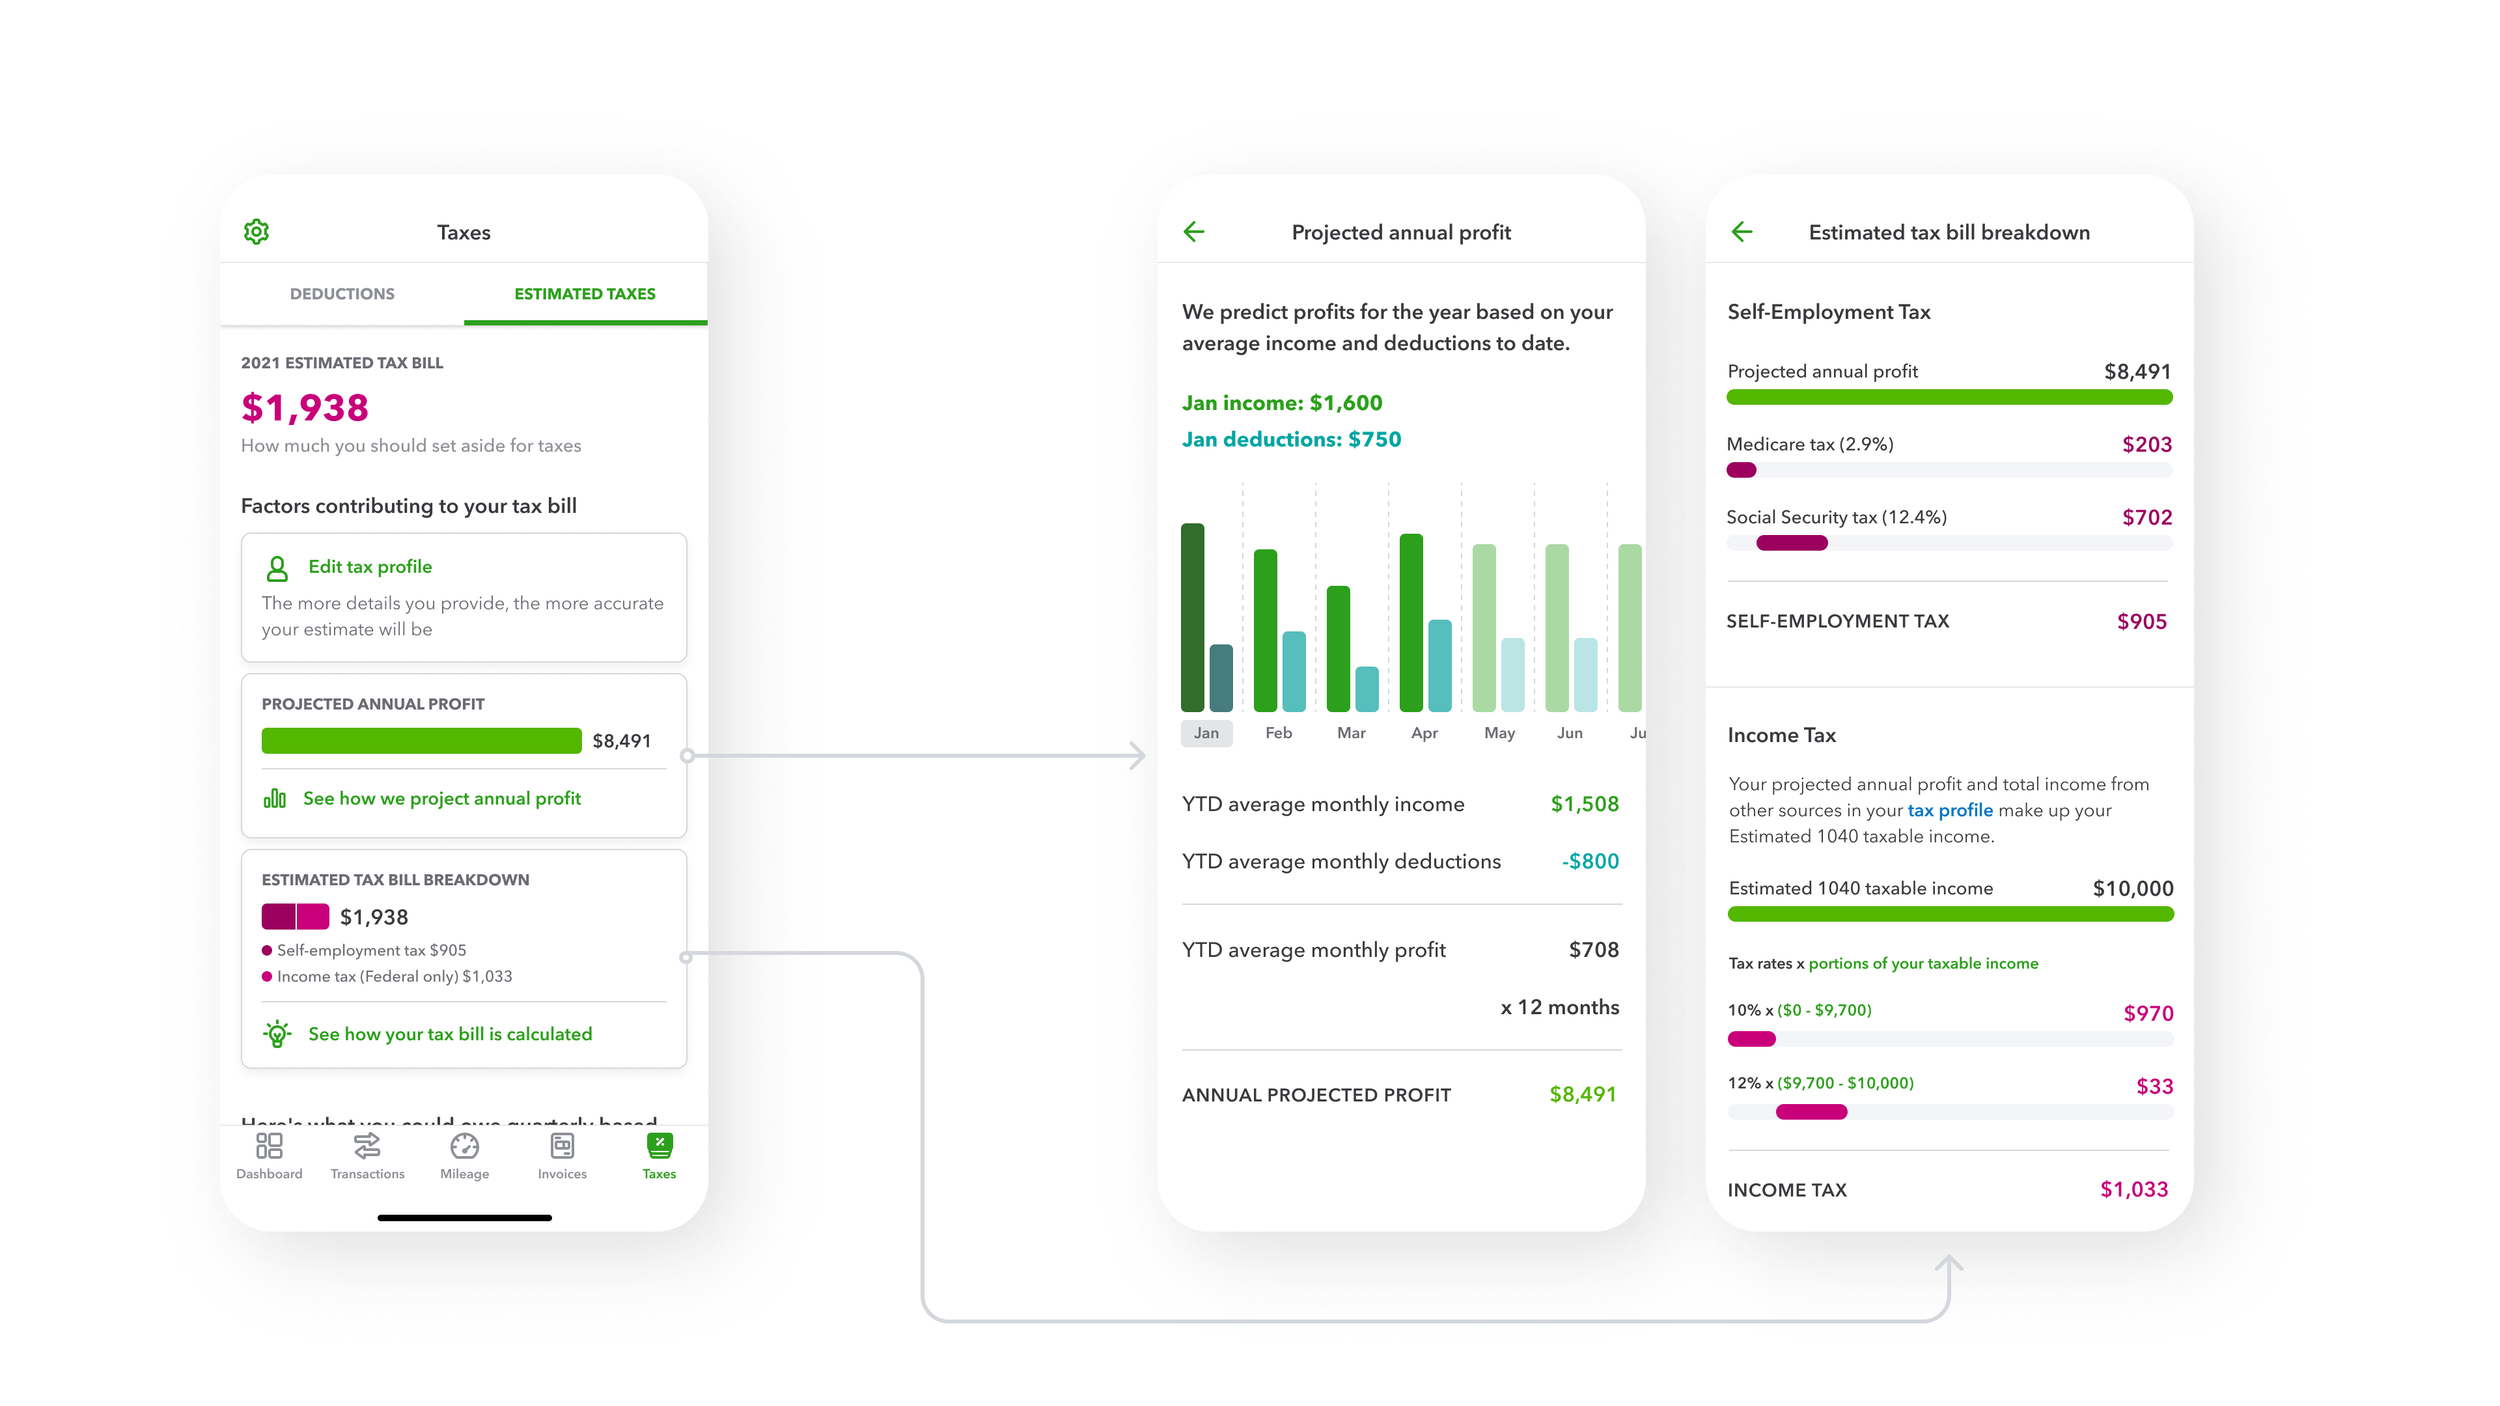
DESIGN APPROACH
Since a major input of the tax calculation was personal information from in the tax profile, we focused on redesigning and improving the tax profile flow.
We created detail pages showing the back-end work being done to cast projections and calculate an estimated tax bill.
DESIGN DECISION 1
Making tax profile comprehensive and easier to follow
By updating the tax profile to take into account more nuanced elements of their holistic tax situation, SEs can be confident that the tax estimate amount is more accurate

DESIGN DECISION 2
Grounding the tax calculation to reflect the work they’ve done
SEs have already done a lot of work to categorize their transactions, so any calculations should leverage this. By showing how categorizing transactions can help provide more accurate tax estimations, we help close the habit loop.

DESIGN DECISION 3
Simplifying complex tax calculation formulas into digestible screens
SEs have more confidence in QB’s projection accuracy by taking into account personal tax information, project future income and deductions, and calculate their tax estimate.